Building a Production Observability Stack with Grafana, Prometheus, Loki, and Alloy
🇩🇪 Auf Deutsch lesen~3 min read
DevOpsObservabilitygrafanaprometheuslokialloymonitoringdocker-compose
Back openDesk Edu for a sovereign, open-source education — every vote counts.
Vote nowSave products you love by clicking the heart icon.
Essential reference for Prometheus querying (PromQL), Grafana dashboards, alerting rules, exporters, and observability best practices.
Managed observability services (Datadog, Grafana Cloud, New Relic) are powerful but expensive. At scale, a self-hosted Grafana + Prometheus + Loki stack saves thousands per month and gives you full control over retention, alerting, and data governance.
The stack presented here runs on any single VM with Docker Compose, and scales horizontally to Kubernetes without architecture changes.
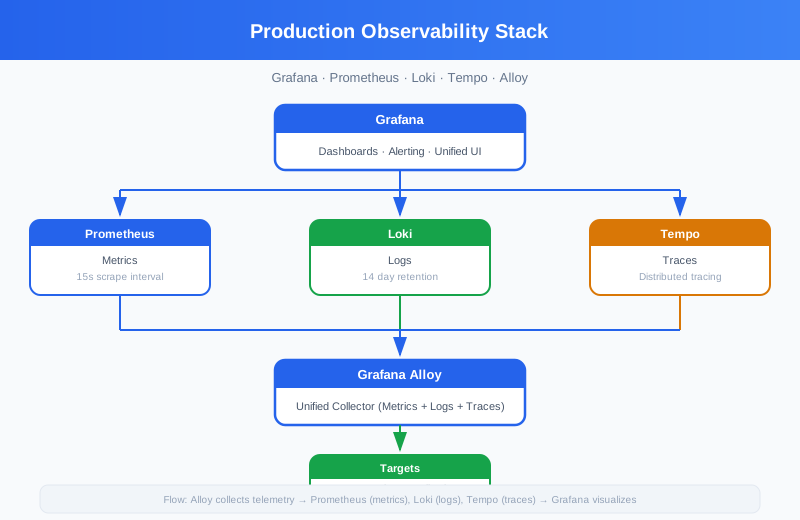
Grafana serves as the unified dashboard layer. With auto-provisioned data sources, connecting Prometheus (metrics) and Loki (logs) takes zero manual configuration after first deploy.
Key configuration decisions:
Prometheus scrapes targets on a pull model. The configuration decision that matters most is scrape interval vs. storage cost:
| Scrape Interval | Daily Storage (per host) | Retention | Use Case |
|---|---|---|---|
| 15s | ~150 MB | 30 days | Critical infra |
| 30s | ~75 MB | 14 days | Standard |
| 60s | ~35 MB | 7 days | Non-critical |
The stack defaults to 15s for core targets (node_exporter, cAdvisor) and 30s for application endpoints. This gives good granularity without blowing up storage.
Unlike Elasticsearch, Loki does not index log content — it indexes only metadata labels. This makes it dramatically cheaper to operate:
job, instance, container_nameThe key configuration parameter is retention_period. The stack defaults to 14 days at which point log data is automatically pruned.
Grafana Alloy replaces the previous agent / promtail / tempo pattern with a single binary that handles metrics, logs, and traces. Its configuration uses a new DSL called Alloy syntax (.alloy files):
// Discovery: find all Docker containers
discovery.docker "local" {
  host = "unix:///var/run/docker.sock"
}

// Scrape metrics from discovered containers
prometheus.scrape "default" {
  targets    = discovery.docker.local.targets
  forward_to = [prometheus.remote_write.default.receiver]
}

prometheus.remote_write "default" {
  endpoint {
    url = "http://prometheus:9090/api/v1/write"
  }
}
This replaces the old pattern of running node_exporter + promtail + cadvisor as separate processes.
The biggest operational cost in an observability stack is storage. Set retention based on your actual needs:
# Loki: 14 days of raw logs, archive older to S3
# Grafana: snapshot dashboards periodically, don't rely on browser cache
Grafana's built-in alerting replaces standalone Alertmanager. Alert rules evaluate against Prometheus queries and route via contact points:
This stack runs on a single 2 vCPU / 4 GB RAM VM for workloads up to ~50 hosts. Beyond that: